It is clear from the previous discussion that there is a
measure of spatial stability over the thirty year study
period from 1980 to 2010 (INDEX: 1980, 1990, 2000, 2010). However,
the question about relative poverty and affluence has not been
addressed, specifically whether there has been any economic
convergence of divergence between the richest and poorest
counties.
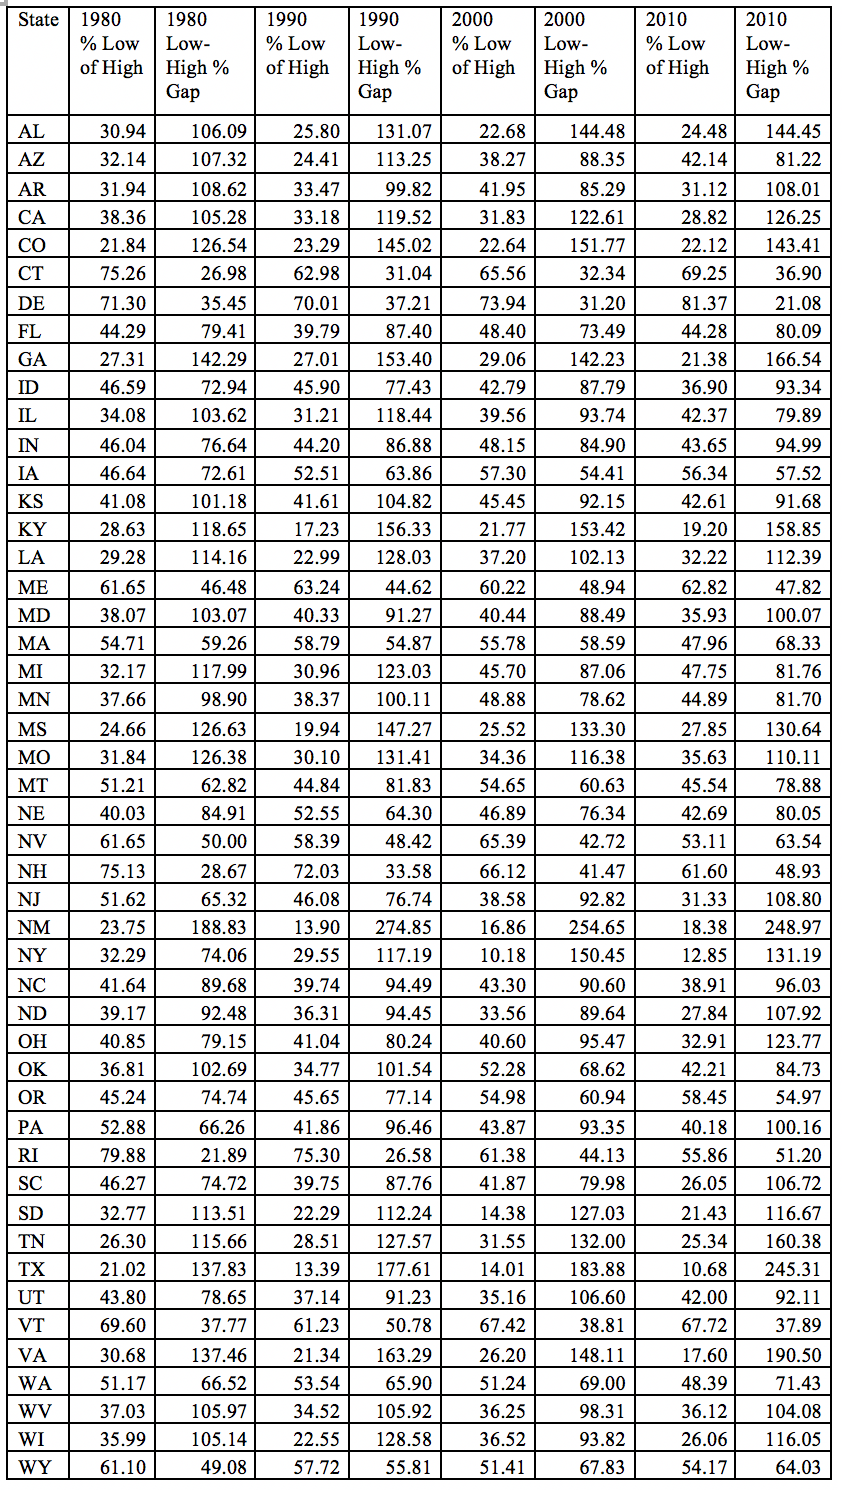
To get a sense of changes in relative poverty and affluence,
data at the state level was used. For each study year the
average INDEX, the dollar gap between poorest and most
affluent county, the poorest county as a percent of both the
state average and most affluent county, the most affluent
county as a percent of both the state average and the poorest
county, and the percentage gap between the poorest compared to
the average and the most affluent county compared to the state
average. These measures give a view of the level of inequality
for each state in each study year. These measures can then be
used to assess changes over time. In particular, the poorest
county INDEX as a percentage of the most affluent county INDEX,
and the percentage gap of the richest and poorest counties with
respect to the state average, provide a view of changing
inequality in each state (Table 10).
Table 10. The Poorest County Compared to the State Average and
the Poorest and most Affluent Percentage Gap compared to the
State Average in 1980, 1990, 2000, and 2010.