Introduction
The 1980 BASELINE
In 1980 the level of Index in the poorest county expressed
as a percentage of that in the most affluent county varies
in a range from 21.02 in Texas (Starr County 1382.49 and
Loving County 6576.49) to Rhode Island 79.88 (Providence County
3901.90 and Kent County 4884.75) (Figure 18). There
appears to be a regional dimension to the inequality between
the poorest and most affluent counties at the state level.
Of the 10 states with the lowest INDEX expressed as a
percentage in the most affluent county, six are in the
southeast (AL, GA, KY, LA, MS, TN). At the other end of the
spectrum, seven New England states dominate the top 10
showing the least inequality (CT, DE, MA,ME, NH, RI, VT).
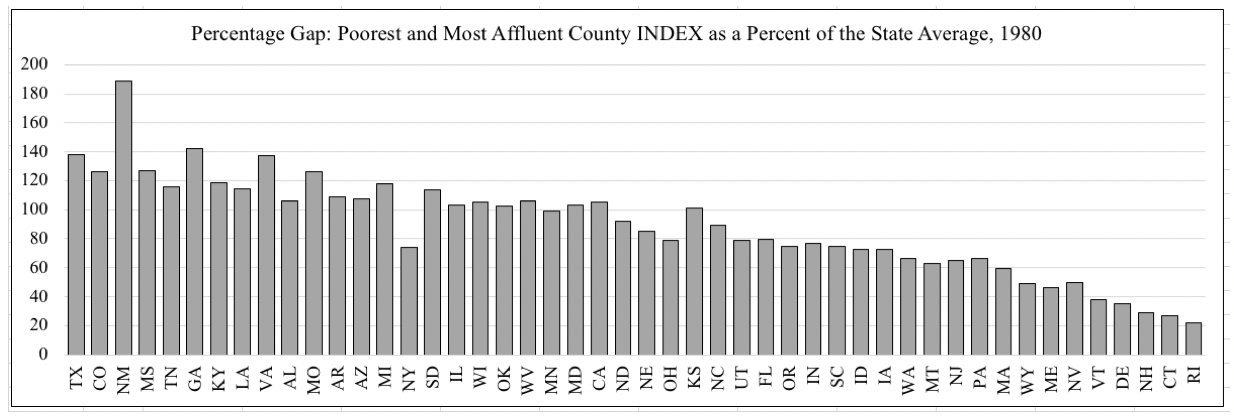
The percentage gap was highest in New Mexico at 188.83
(the most affluent county was 247.65 percent of the average
while the poorest was 58.82 percent). The lowest gap was
in Rhode Island (the most affluent county was 108.78
percent of the average while the poorest was 86.89 percent),
resulting in a 21.89 percentage gap (Figure 19). Of course
the size of states certainly influences these characteristics,
and as indicated in earlier discussion, context must be
considered. Changes over time perhaps provide a general
sense of whether convergence or divergence is occurring.
Figure 18. State Poorest County INDEX as a Percent of the
Most Affluent County INDEX by State, 1980
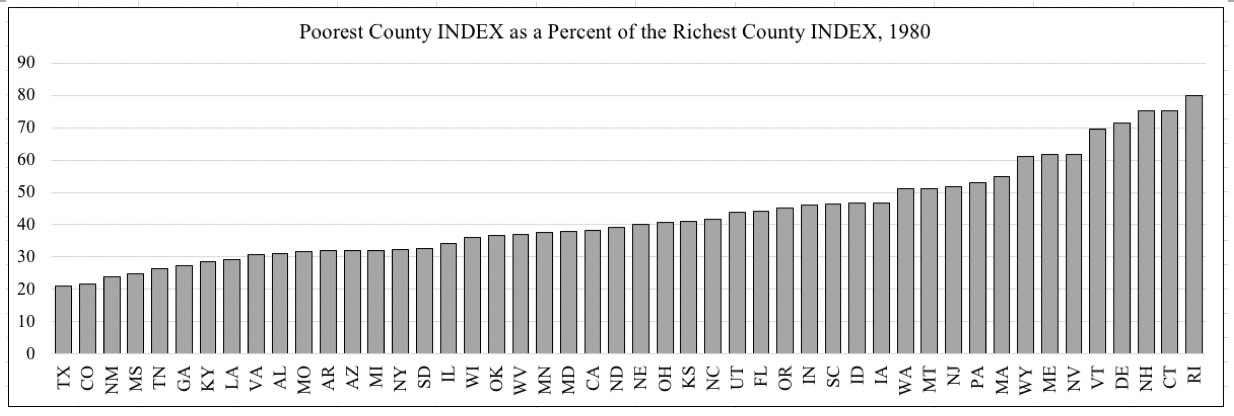 Figure 19. Poorest and Most Affluent Percentage Gap
Compared to State Average, 1980
Figure 19. Poorest and Most Affluent Percentage Gap
Compared to State Average, 1980