U.S. POVERTY IN 1990
The 1990 ranking by INDEX of counties that were poorest in 1980
reveals a relative stability within the poorest segment of counties
over the 1980s (Figure 5). Of the 157 counties identified as the
poorest 5 percent in 1980, 104 still remained in this segment in
1990. While some counties, such as Faulk, Miner and Sanborn Counties,
South Dakota, did appear to make a meteoric rise out of poverty, most
remained among the poorest counties in America. For those counties
that remained within the most impoverished 5 percent there was some
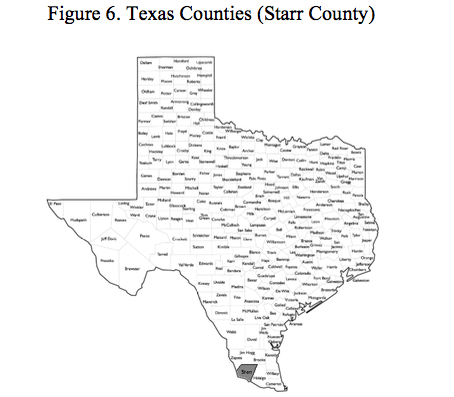
variation in relative position. Starr County, Texas (Figure 6) took
over the dubious honor of being the most impoverished county in 1990
from Tunica County, Mississippi. Tunica County, meanwhile rose seven
positions in the ranking. Such changes do little to change the spatial
picture of American poverty in 1990, and the same states embrace the
largest number of impoverished counties as in 1980 (Table 1). By 1990
the poorest 50 counties are located in just 9 states; these same 9
states account for 107 of the poorest 150 counties. Two states alone
(Mississippi and Kentucky) encompass 23 of the poorest 50, 38 of the
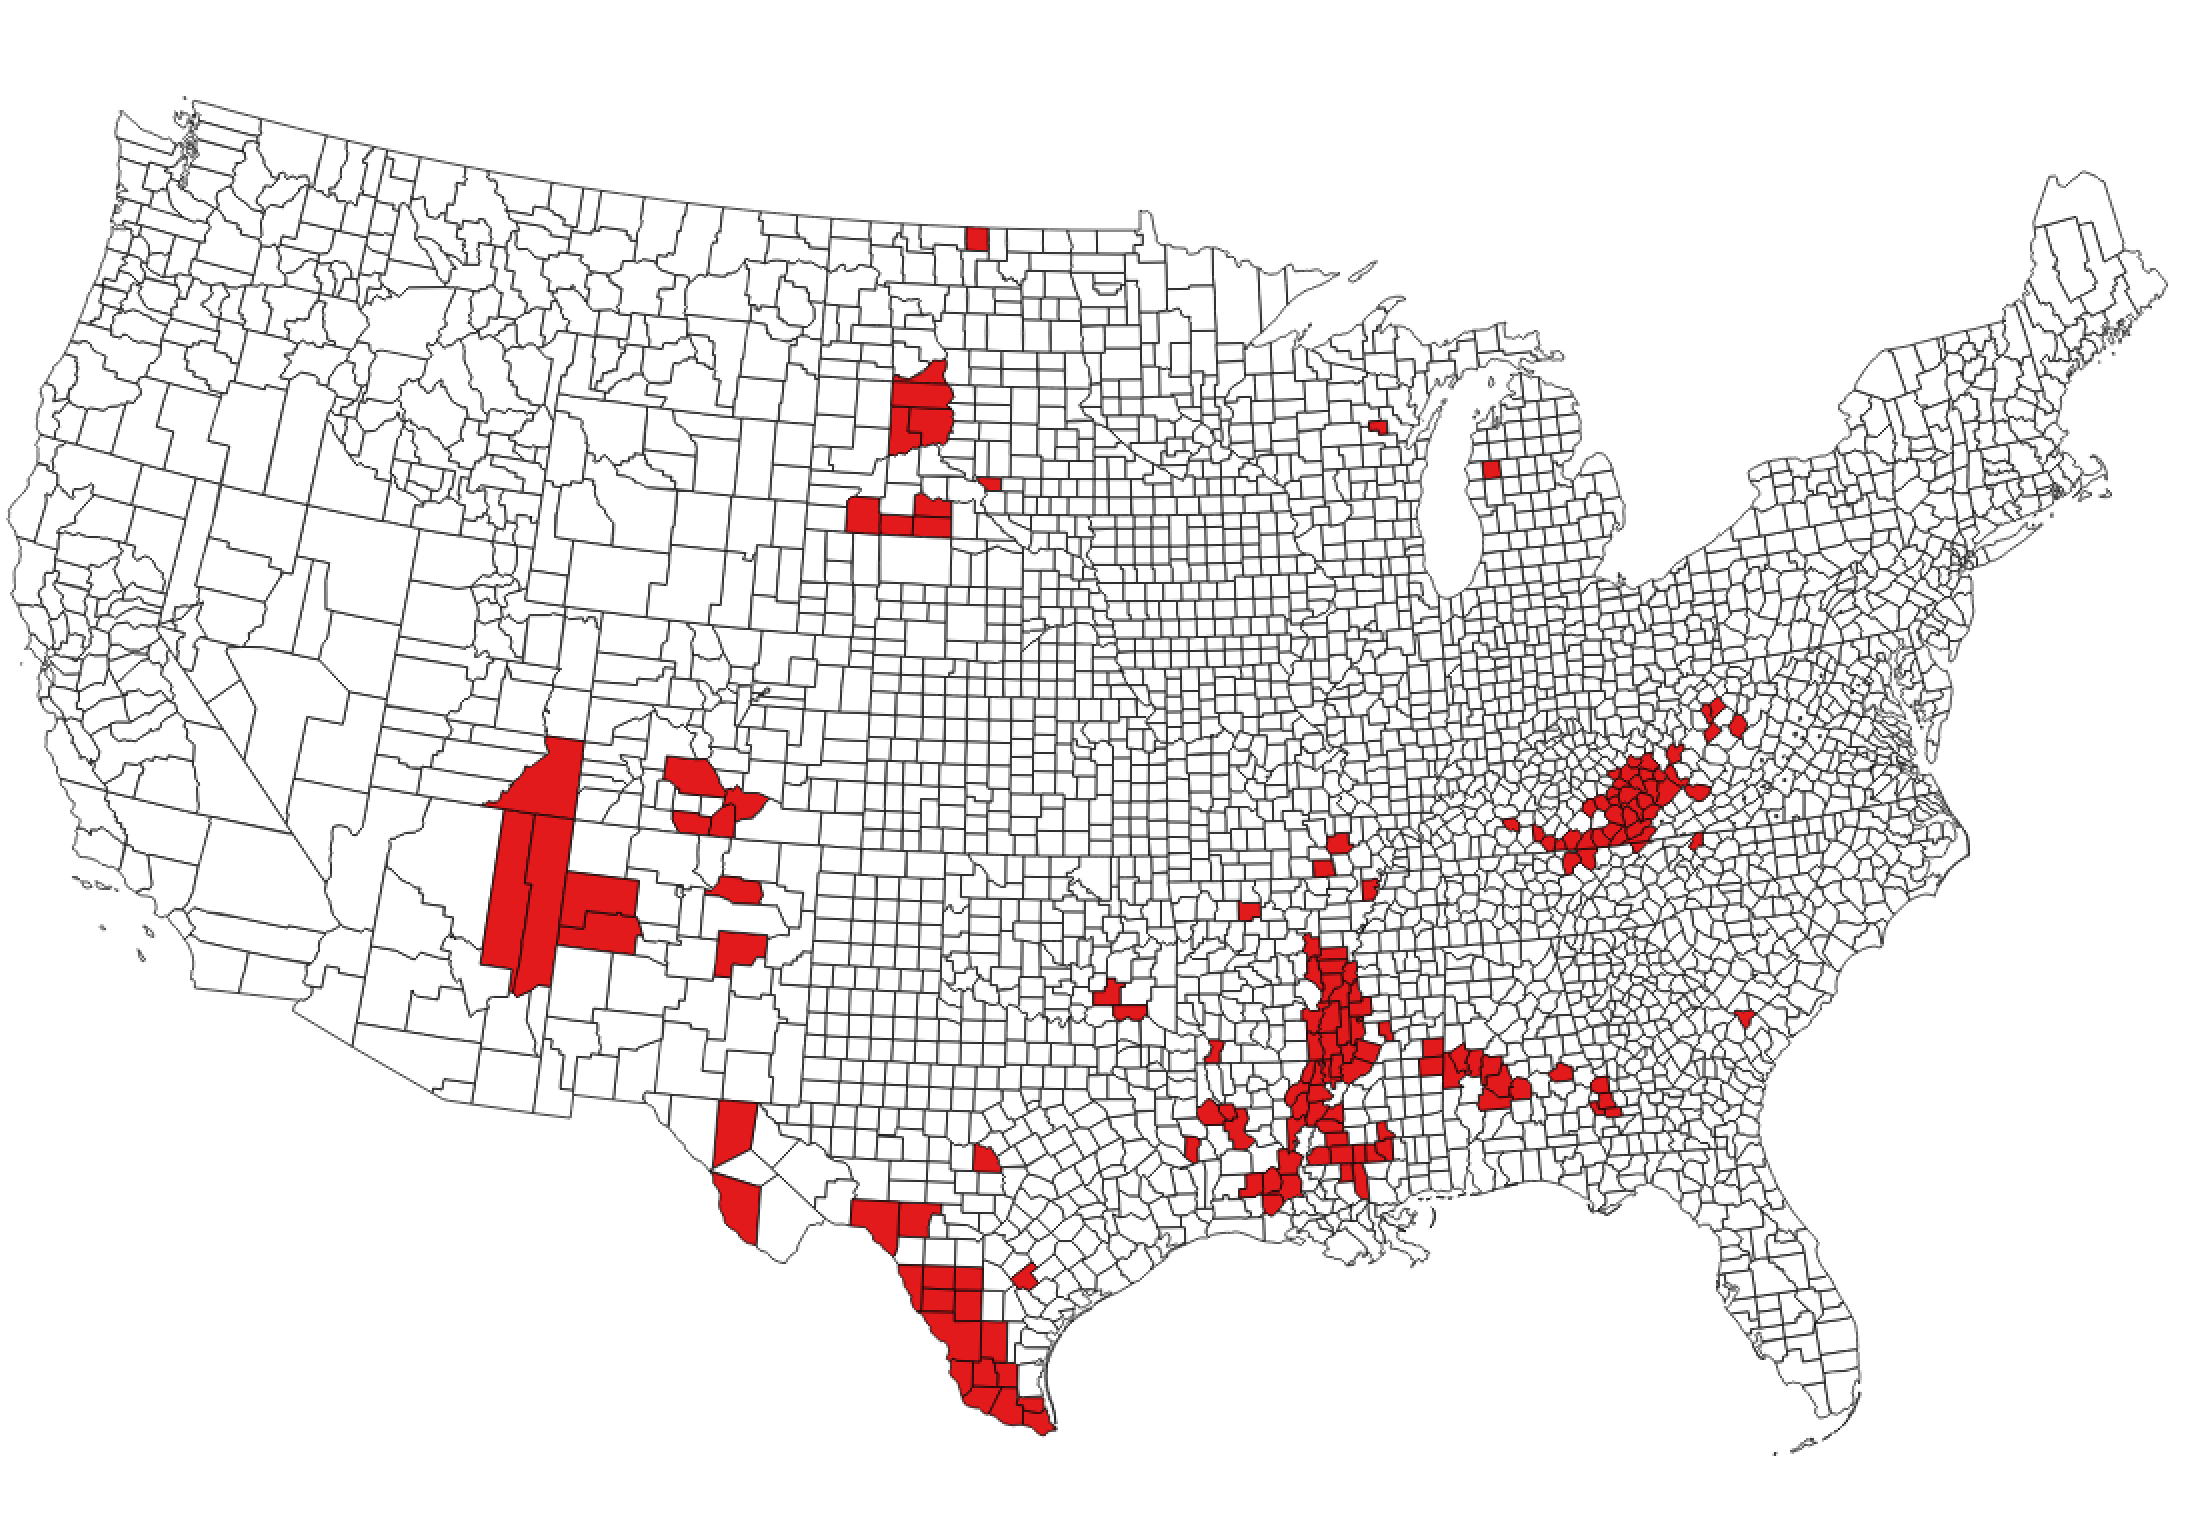
poorest 100, and 53 of the poorest 157 (5 percent) of counties. Mapping
the poorest 5 percent of counties in 1990 (Figure 4) shows that these
counties are even more spatially concentrated than they were in 1980.
Coherent areas of extreme poverty clearly remain centered in South
Dakota, eastern Arizona, the Texas-Mexican border, the southern
Mississippi River valley-southern coastal plain, and the central
Appalachians.
[Census: Starr Co, Quick Facts]
Figure 5. The Poorest 5 Percent of Counties, 1990