U.S. POVERTY IN 1980
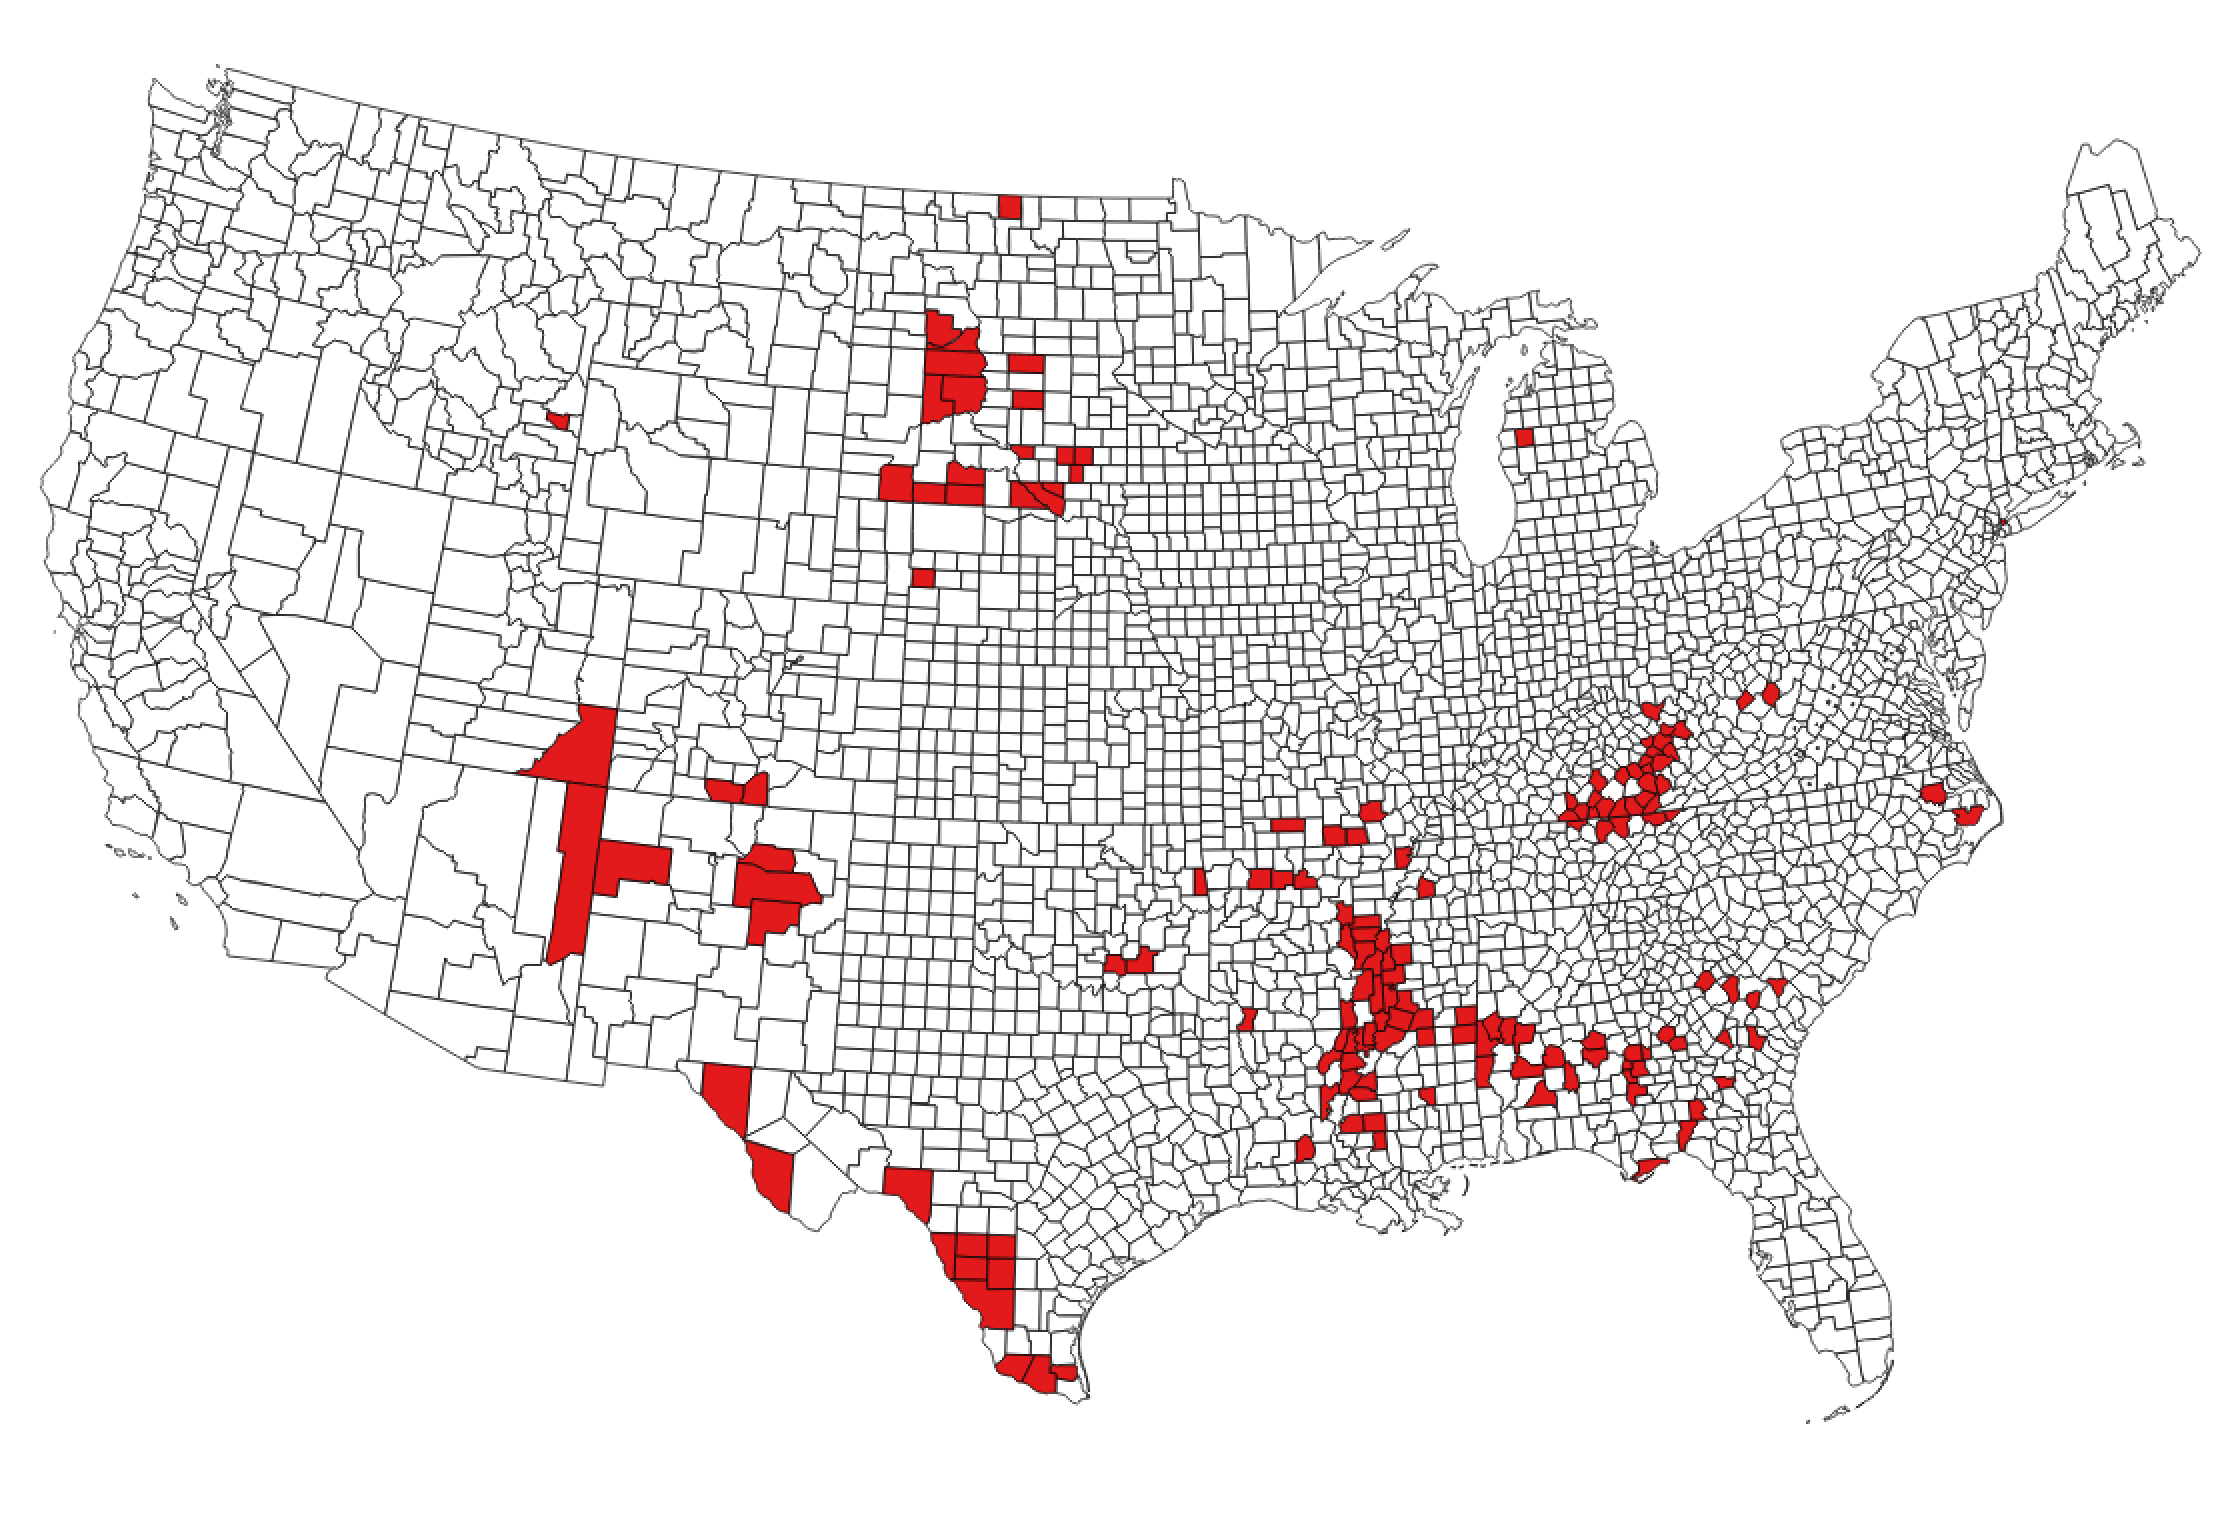
The poorest 5 percent of counties in terms of INDEX for 1980 are presented
in Figure 2 which reveals that a distinct spatial pattern characterized U.S.
poverty. Five core areas of poverty existed in 1980. The first poverty core
was located in the region encompassed by southern Utah, northeast Arizona,
western New Mexico, and south-central Colorado. This poverty region was
located in an area with relatively high (on average 26 percent) Native
American population (U.S. Department of Commerce 1983). Indeed, much of this
poverty core, including the intensely impoverished Apache County, Arizona,
is located on reservation land.
A second area of intense poverty existed throughout central South Dakota
extending into south-central North Dakota. This poverty core has a very
high (on average over 60 percent) Native American population (U.S. Department
of Commerce 1983). Again, much of this poverty core, such as Corson, Shannon,
Todd, and Ziebach Counties is reservation land.
A third distinct poverty area extended almost the entire length of the Texas-
Mexico border. This is in keeping with the research of Jones and Kodras who
link poverty status to Hispanic ethnicity (Jones and Kodras 1990). Of the 13
Texan counties with the highest percentage of Hispanic population, 11 were
contained within the identified poverty core. On average the counties in
this core were over 67 percent Hispanic, and the most intensely impoverished
counties of Maverick, Presido, Starr, and Zavala had approximately 92 percent
Hispanic population compared with 21 percent for the state as a whole (U.S.
Department of Commerce 1983).
A fourth broad area of poverty can be seen to have extended along the Mississippi
River from Louisiana to southern Illinois; this poverty region also spanned much
of Mississippi as well as the southern coastal plain from Alabama to North Carolina.
The region identified supports the comments of other researchers (Brunn and Wheeler
1971; Smith 1972; Smith 1979; Jones and Kodras 1990) who suggest that the
concentration of poverty across the South mirrors the distribution of the rural
African American population. The most intensely impoverished of the counties
contained within this core lay along the Mississippi River from central Arkansas
and northern Mississippi to southern Mississippi and northern Louisiana, and in
southern Alabama. All these counties, with the exception of West Carroll County,
Louisiana, had substantially higher percentages (on average over 54) of African
American population than the averages for their state. In these most severely
impoverished counties in 1980 African Americans were a majority of the population
(U.S. Department of Commerce 1983).
A fifth core of poverty, which was particularly geographically coherent, spanned
most of eastern Kentucky and extended into northern Tennessee. In contrast to the
four previously identified cores of poverty this area had no concentration of minority
population. Instead, the population of the counties in this region are, on average,
over 98 percent white.
The concentration of poverty in 1980 in relatively few core areas is further
illustrated by Table 1. The poorest 50 counties are located in just 11 states;
moreover, these same 11 states account for 124 of the poorest 150 counties. Two
states alone (Mississippi and Kentucky) encompass 20 of the poorest 50, 34 of the
poorest 100, and 50 of the poorest 157 (5 percent) of counties. The poorest 5% of
counties were located in a total of 24 states in 1980, It is the poverty areas
centered in Mississippi and Kentucky that can be said to represent the cores of the
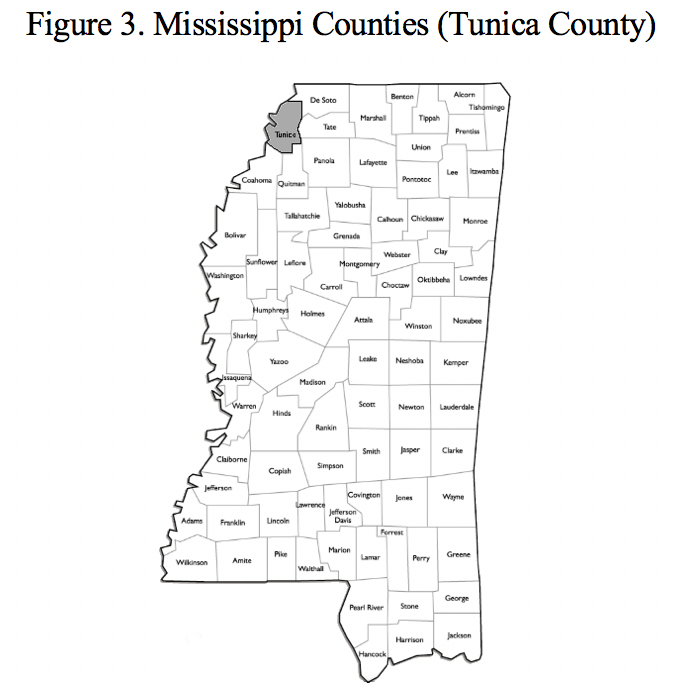
most intense poverty within the United States. In 1980 the poorest county in the
United States was Tunica County, Mississippi, that is a county in the northwest of
the state that borders the Mississippi river (Figure 3).
[Census: Tunica Co, Quick Facts]
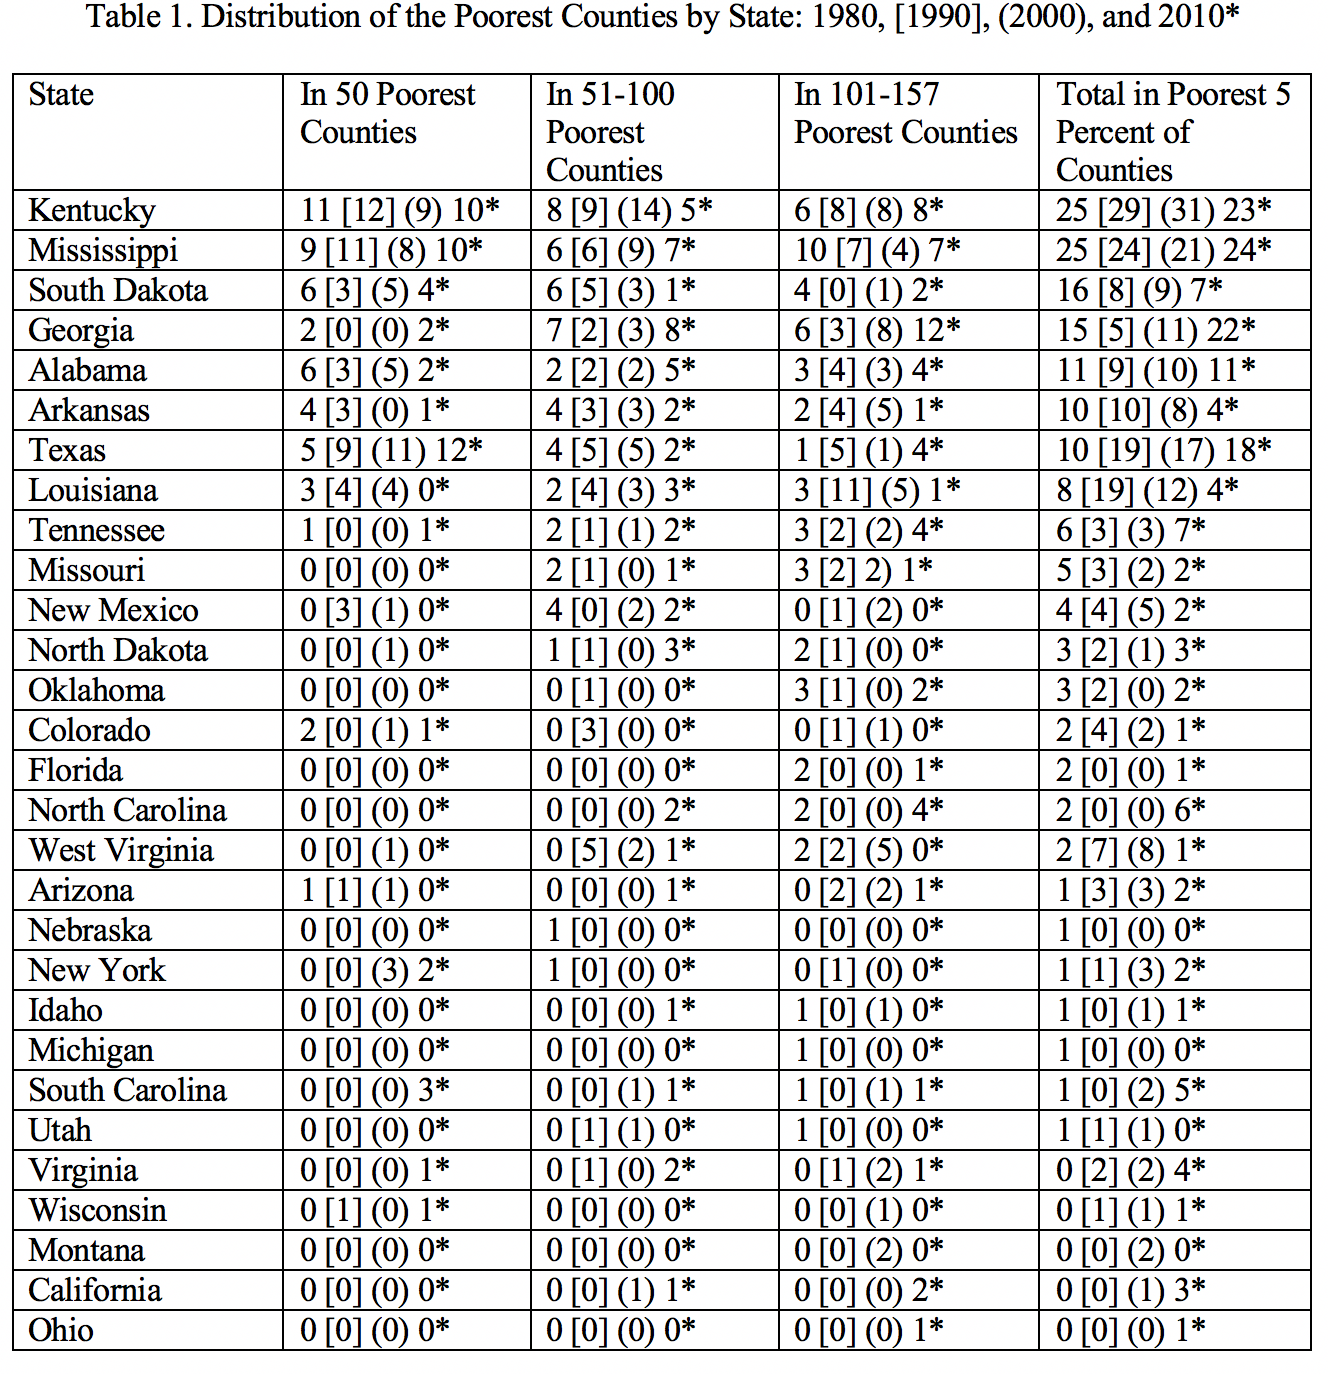 Figure 2. The Poorest 5 Percent of Counties, 1980