U.S. POVERTY IN 2000
Figure 9 reveals the spatial distribution of the poorest 5 percent
of counties in 2000. Clearly the general spatial pattern has continued
to be relatively stable, with the same five cores of poverty
counties included in the poorest 5 percent in 1990, 114 remained in
this poorest segment in 2000. An additional 15 counties that were
among the poorest 5 percent in 1980 but not in 1990 reentered this
poorest segment in 2000. Once again counties in the same states dominate
the listing of the poorest counties (Table 1). Forming the most temporally
stable core of poverty, 88 counties remained in the poorest 5 percent in
all three study years.
Despite the general spatial stability of U. S. poverty over the 20 year
period from 1980 to 2000, there are some changes to note. Interestingly
the county characterized as the poorest in the United States once more
shifted. In 1980 it was Tunica County, Mississippi (ranked 8th poorest
in 1990 and 99th poorest in 2000); in 1990 it was Starr County, Texas
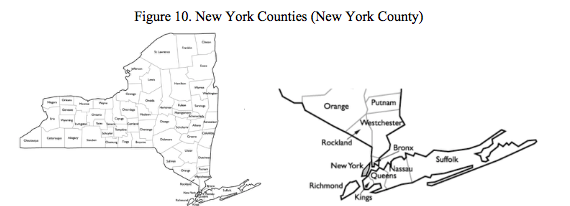
(ranked 3rd poorest in both 1980 and 2000). In 2000 the poorest county
was New York County, New York (ranked 189th poorest in 1990 and 249th
poorest in 1980) (Figure 10). For the first time within the study period
the poorest county was clearly urban. New York County, New York is the
quintessentially urban county with a very different demographic, social,
and economic profile than Tunica County, Mississippi and Starr County
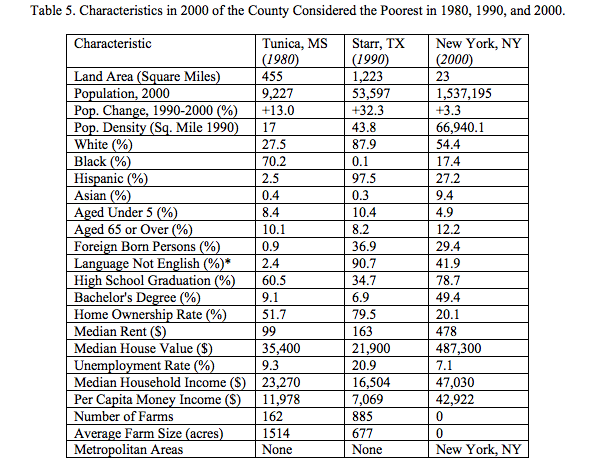
Texas. Table 5 provides some basic information in order to illustrate
this contrast.
Figure 9. The Poorest 5 Percent of Counties, 2000
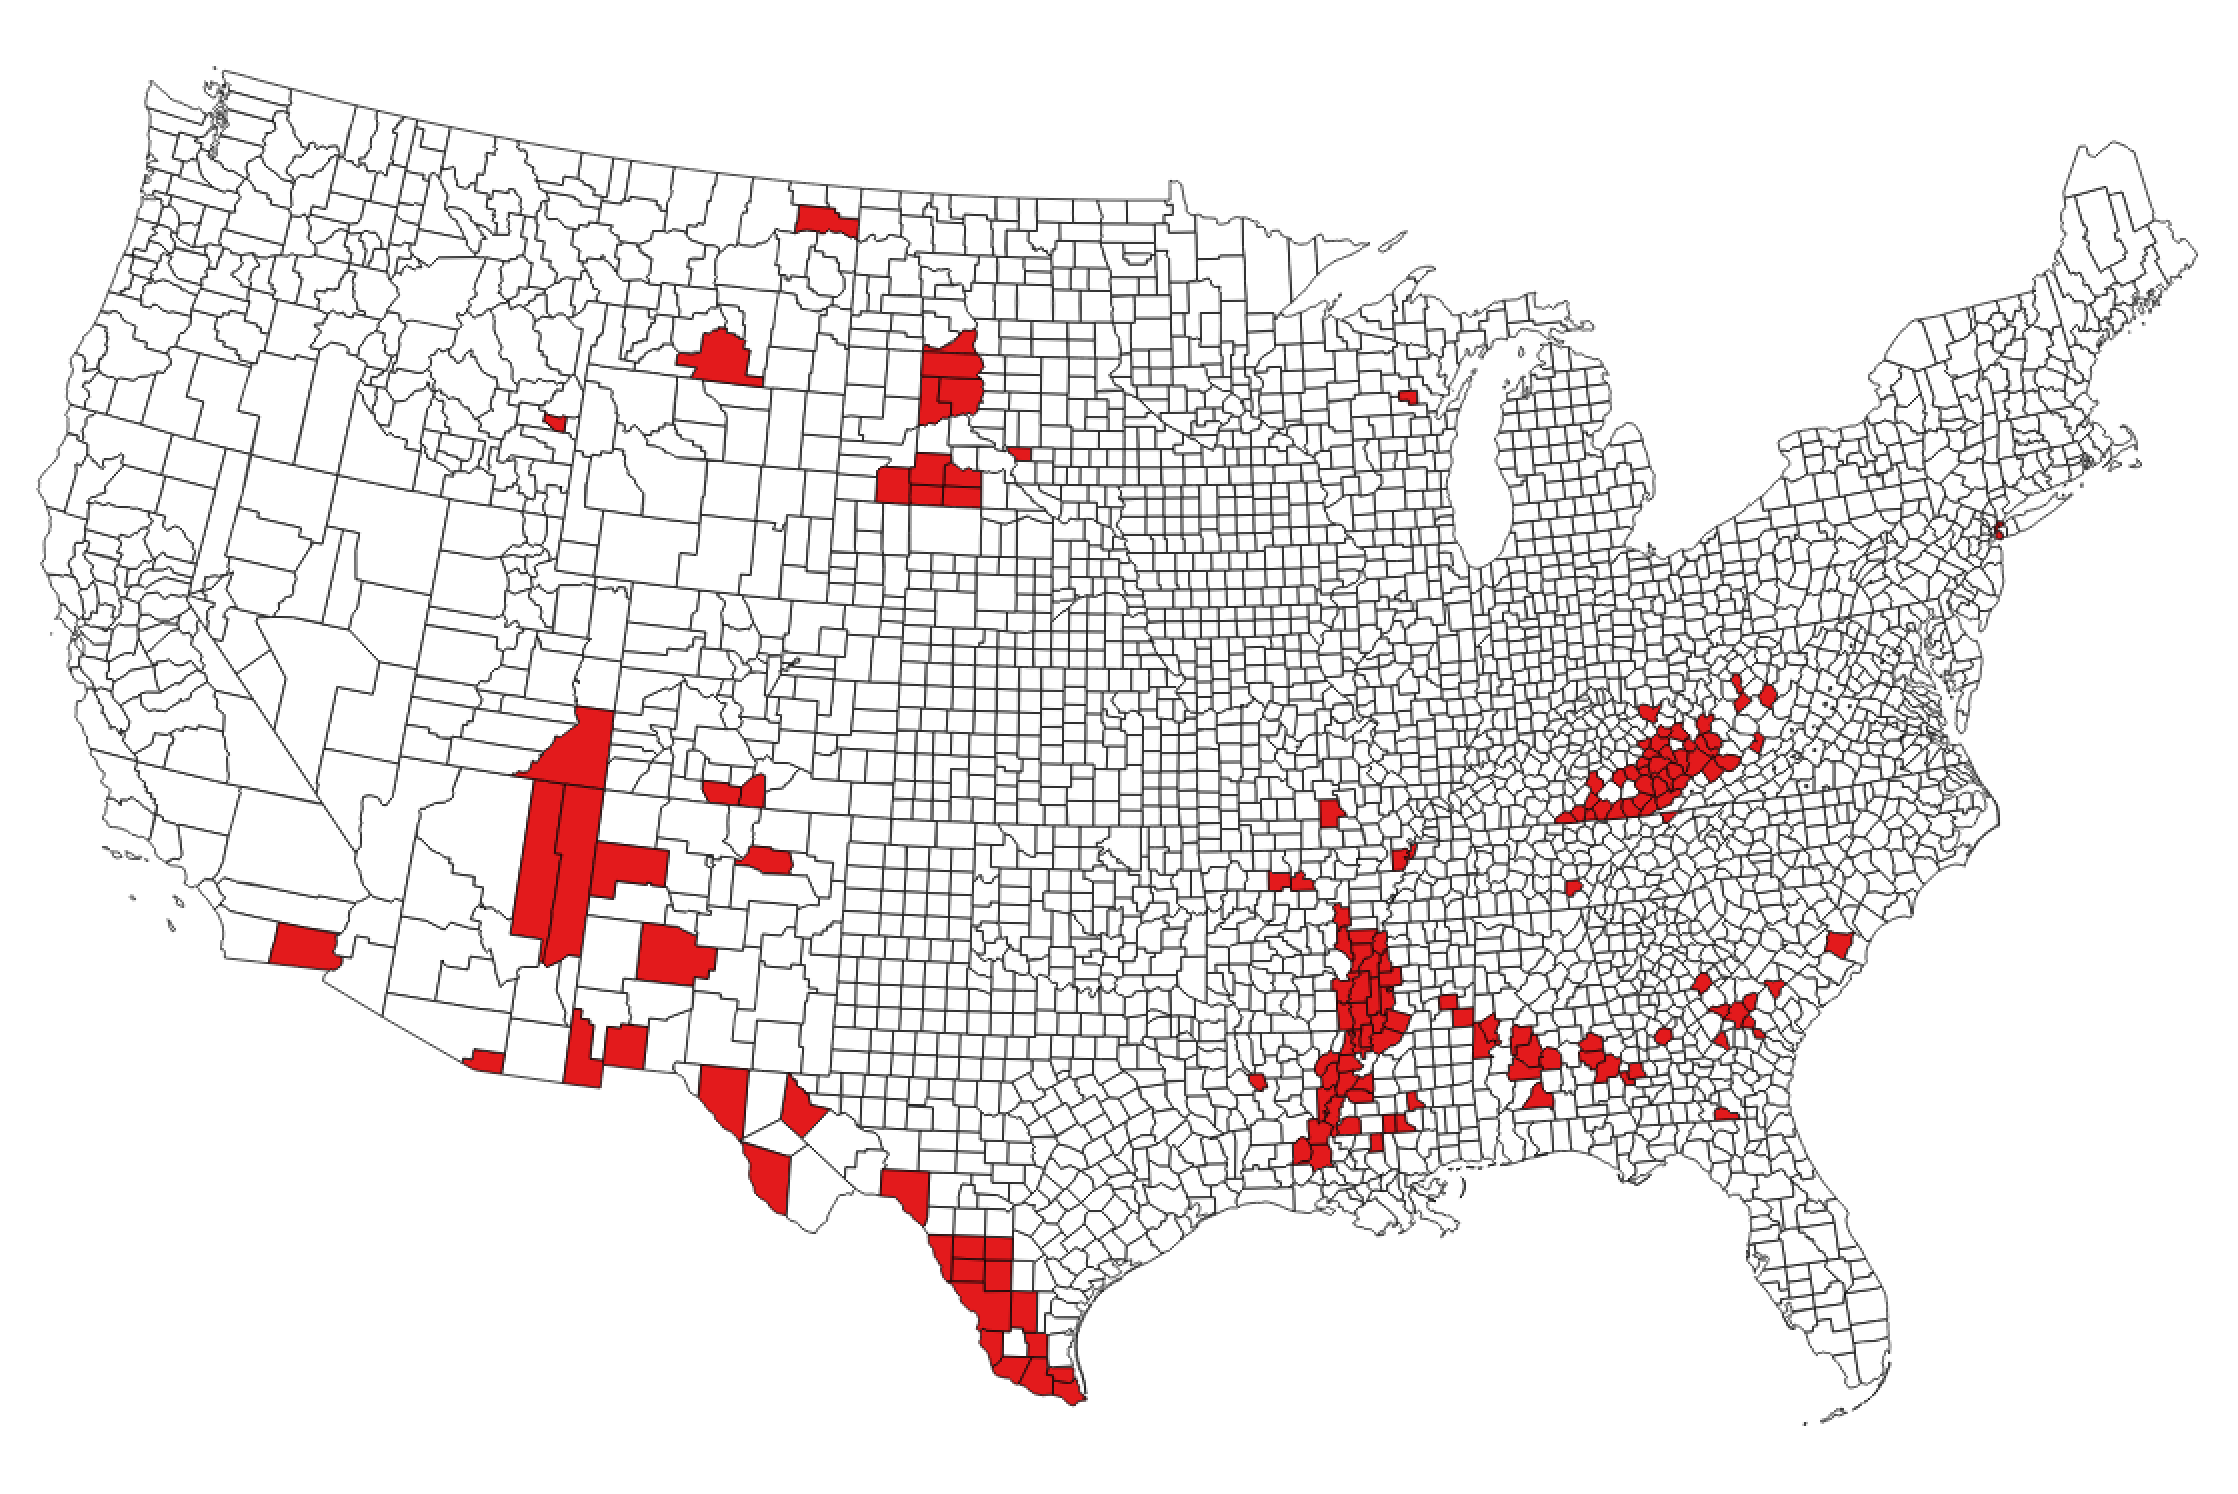
 Source Accessed 13 February 2004
Tunica County, Mississippi, the most impoverished county in 1980, can
clearly be characterized as rural. Population density is low, farm sizes
are large, and the people of Tunica County are primarily African-American.
Starr County, Texas poorest in 1990, is also rural but both the total
population and population density are higher than in Tunica County.
In addition, the population in Starr County is overwhelmingly Hispanic,
over one third are foreign born, and over 90 percent do not speak English
at home (but can be assumed to speak primarily Spanish). High school
graduation rates are also substantially lower in Starr County than they
are in Tunica County. While Tunica and Starr counties clearly have both
differences and similarities when compared to each other, New York County,
New York, which was the poorest county in 2000, has virtually no commonality
with either Tunica County or Starr County. New York County is within the
New York Primary Metropolitan Statistical Area (PSMA) and extends over a very
small area, yet is home to over 1.5 million people. With a population density
approaching sixty seven thousand per square mile, and racial and ethnic
diversity not seen in Tunica or Starr counties, New York County is clearly
urban in every sense. The residents in New York County are well educated
with almost half the population holding a bachelor's degree, but they must
deal with extremely high property values. Home ownership rates in both
Tunica and Starr counties are much higher than in New York County. The
unemployment rate in New York County is low especially compared to that in
Starr County and income relatively high, yet when housing costs are taken
into consideration it is the quintessentially urban county of New York, New
York that can be considered the poorest county in 2000 when using INDEX as a
measure. Unlike the definition of poverty used by the U.S. Census Bureau,
INDEX incorporates housing costs, and it is this consideration of housing
costs that is responsible for identifying New York County, New York as poor.
[Census: New York Co, Quick Facts]
Source Accessed 13 February 2004
Tunica County, Mississippi, the most impoverished county in 1980, can
clearly be characterized as rural. Population density is low, farm sizes
are large, and the people of Tunica County are primarily African-American.
Starr County, Texas poorest in 1990, is also rural but both the total
population and population density are higher than in Tunica County.
In addition, the population in Starr County is overwhelmingly Hispanic,
over one third are foreign born, and over 90 percent do not speak English
at home (but can be assumed to speak primarily Spanish). High school
graduation rates are also substantially lower in Starr County than they
are in Tunica County. While Tunica and Starr counties clearly have both
differences and similarities when compared to each other, New York County,
New York, which was the poorest county in 2000, has virtually no commonality
with either Tunica County or Starr County. New York County is within the
New York Primary Metropolitan Statistical Area (PSMA) and extends over a very
small area, yet is home to over 1.5 million people. With a population density
approaching sixty seven thousand per square mile, and racial and ethnic
diversity not seen in Tunica or Starr counties, New York County is clearly
urban in every sense. The residents in New York County are well educated
with almost half the population holding a bachelor's degree, but they must
deal with extremely high property values. Home ownership rates in both
Tunica and Starr counties are much higher than in New York County. The
unemployment rate in New York County is low especially compared to that in
Starr County and income relatively high, yet when housing costs are taken
into consideration it is the quintessentially urban county of New York, New
York that can be considered the poorest county in 2000 when using INDEX as a
measure. Unlike the definition of poverty used by the U.S. Census Bureau,
INDEX incorporates housing costs, and it is this consideration of housing
costs that is responsible for identifying New York County, New York as poor.
[Census: New York Co, Quick Facts]