Poverty 1980
Poverty 1990
Poverty 2000
U.S. POVERTY IN 2010
Figure 13 displays the spatial distribution of the poorest 5 percent
of counties in 2010. The general spatial pattern characterized by
five cores of poverty has persisted in the 30 years since 1980.
Over the entire study period 17 counties remained in the poorest 50
in 1980, 1990, 2000, and 2010 and another 16 counties remained in
the poorest 50 for three of those years (Figure 14). These 33
counties are located in just 8 states, and only 4 states had the
17 counties in the poorest 50 in all four years: Kentucky (5),
Texas (4), Mississippi (3), South Dakota (3), Alabama (2) (Table 7).
In 2000 the poorest county was urban, and in 2010 this was again the
case. By 2010 rather than New York County being the poorest, to was
neighboring Bronx County (Figure 15). By 2010 poverty in the United
States, viewed at the spatial scale of the county, remains largely
rural in contrast to affluence that is primarily urban. However, the
poorest and the richest counties were both urban in 2000 and 2010.
Leaving the unique Los Alamos and Loving counties aside, it seems
that the Bronx, New York and Fairfax County, Virginia represent the
extremes of U.S. poverty and affluence located in the 'Boswash'
megalopolis.
Table 8 details some characteristics of the Bronx and Fairfax County,
in order to explore some basic differences between the counties that
represent the richest and the poorest. In some ways these two counties
are very similar. Both are quintessentially urban, are home to a
similar number of residents, have a similar age structure, a similar
household size, and the percentage of foreign born residents in both
counties is somewhat comparable. However, several differences stand
out. First is the contrast in population densities with the Bronx being
11.89 times more densely populated than Fairfax County. The racial
profile of the two areas is quite different with the Bronx being home
to a high percentage of African-American and Hispanic residents in
contrast to Fairfax County where white and Asian residents dominate
demographically. The difference in educational achievement, especially
beyond high school is, clear with Fairfax County having a majority of
residents, and more than three times the rate in terms of holding a
bachelor's degree or higher than in the Bronx. Income and employment
levels are also much higher in Fairfax County than in the Bronx. For
example, median household income in Fairfax County is 3.2 times that
in the Bronx.
[Census: The Bronx, Quick Facts]
Figure 13. The Poorest 5 Percent of Counties, 2010
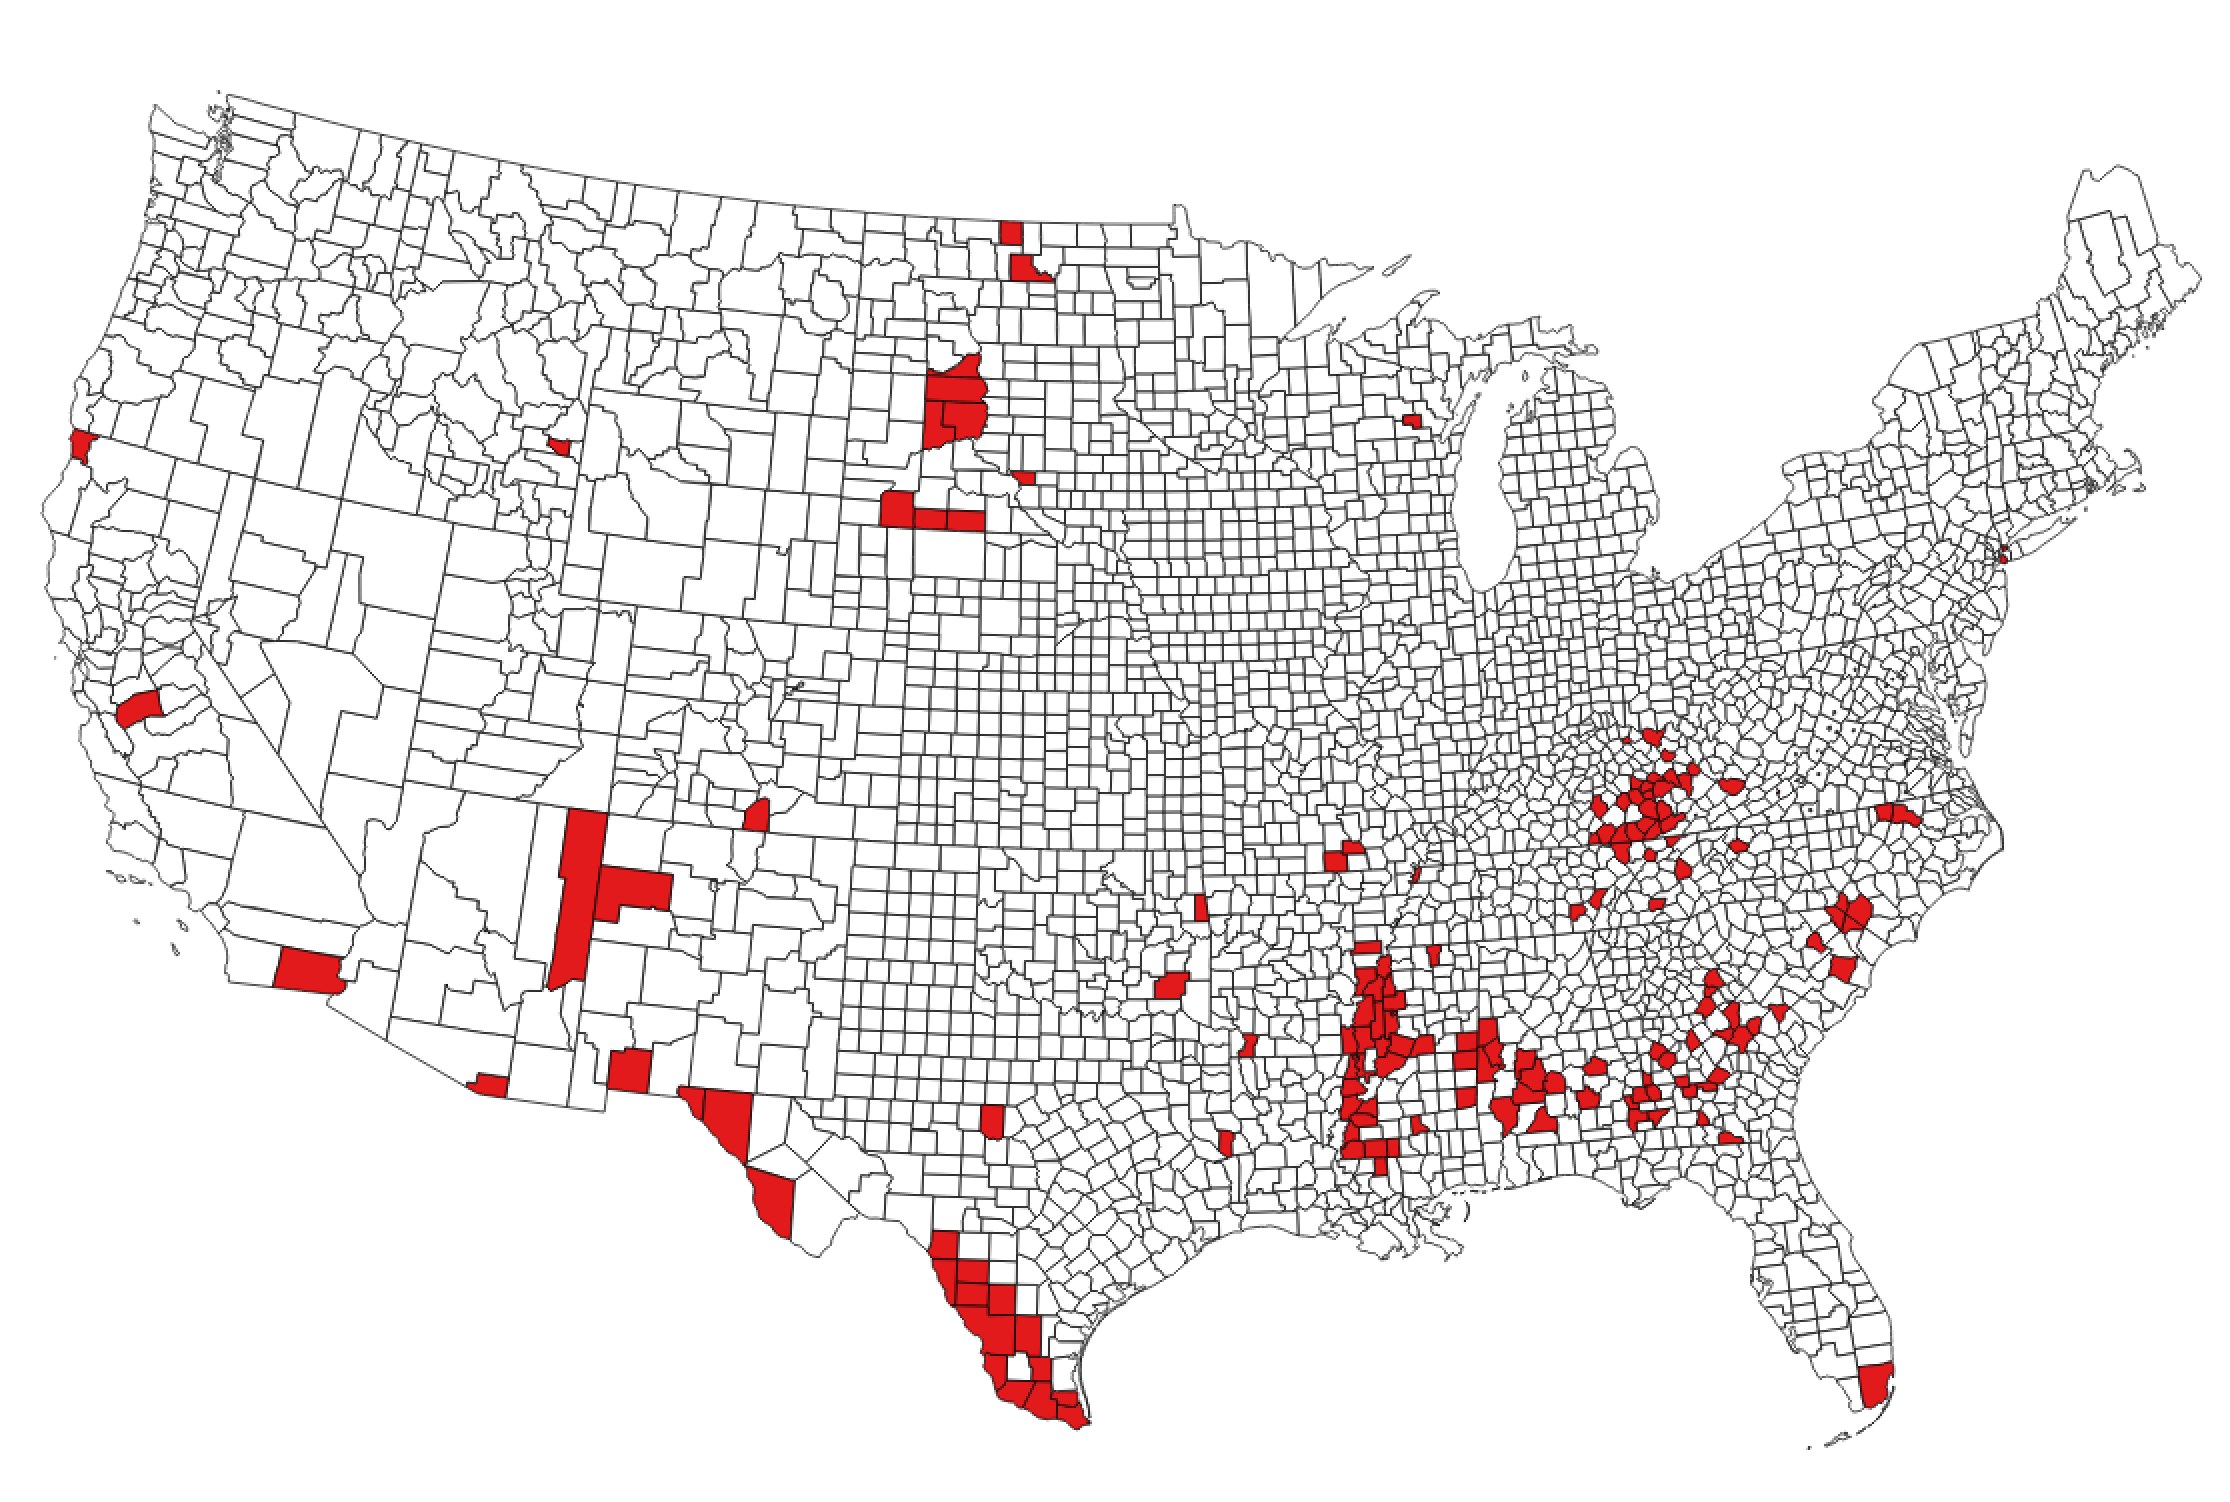 Figure 14. Stable Poverty Cores, 1980, 1990, 2000, and 2010
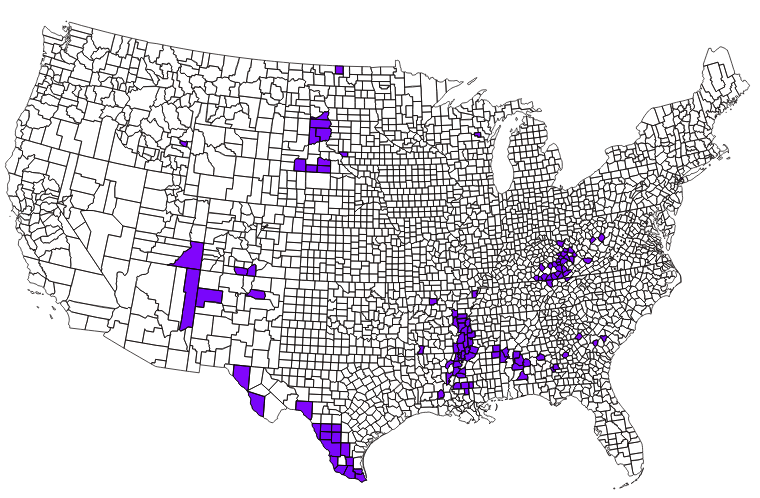 Figure 15. New York Counties (The Bronx)
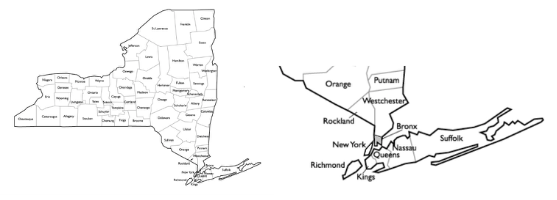 Table 7. Counties Among the Poorest 50 in at Least Three Years; 1980, 1990, 2000 and 2010.
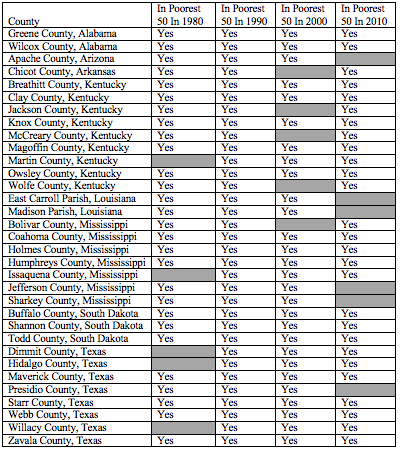 Table 8. Characteristics of the Counties Considered the Richest and Poorest in 2010.
 Source: https://www.census.gov/quickfacts/ Accessed 26 February 2019