U.S. AFFLUENCE IN 1980
The most affluent 5 percent of counties in terms of INDEX for
1980 are presented in Figure 4 and the spatial distribution of
affluence in 1980 is further illustrated by Table 2. The most
affluent 50 counties are present in 20 states, which is a
significantly larger number than the 11 states that are the
location of the poorest 50 counties. While the most affluent
counties are not as clustered in particular states as the
poorest, the greatest number of the 50 most affluent counties
are in Virginia (6), California (4), Colorado (4), and Texas (4).
Interesting three states, Colorado, Georgia, and Texas are the
location of counties in both the poorest and most affluent 50.
Looking at the most affluent 5 percent of counties compared to
the poorest 5 percent, they are located in 28 states compared
to 24 for the poorest counties. Ten states have counties in
both the most affluent and poorest 5 percent. Four states have
10 or more counties within the most affluent 5 percent; Illinois
(16), Virginia (14), Texas (13), and Indiana (10). The most
affluent county in 1980 was Los Alamos County, New Mexico.
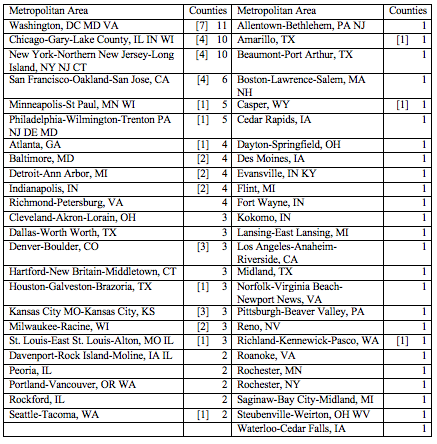
The spatial distribution of these counties lends support to the
contention that suburban counties associated with metropolitan
areas tend to be affluent. While not all metropolitan areas
include counties in the most affluent 5 percent, many do.
Of these most affluent 157 counties, 126 (over 80%) are located
in 49 metropolitan areas, with several metropolitan areas having
multiple such counties. The most affluent 50 counties are
dominated by Washington DC (7), Chicago (4), New York (4), and
San Francisco, with (4) (Table 3). One particularly apparent
exception to this metropolitan spatial pattern of affluence can
be seen in Wyoming; 8 counties are within the most affluent 5
percent, but only one is located within a metropolitan area.
Figure 4. The Most Affluent 5 Percent of Counties, 1980
 Table 2. Distribution of the Most Affluent Counties by State:
1980, [1990], (2000), and 2010*
Table 2. Distribution of the Most Affluent Counties by State:
1980, [1990], (2000), and 2010*
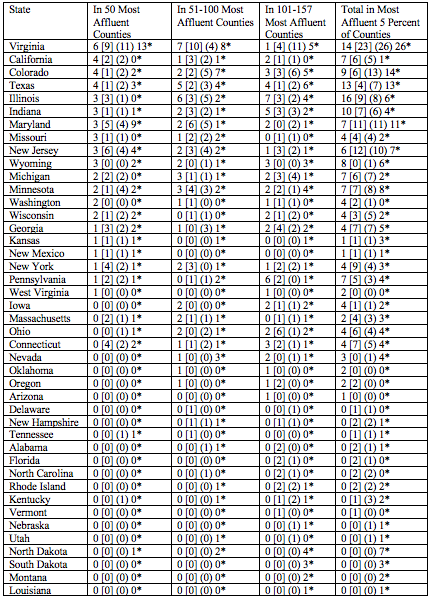 Table 3. Metropolitan Areas with Counties in the Most Affluent
[50] and 5 Percent: 1980
Table 3. Metropolitan Areas with Counties in the Most Affluent
[50] and 5 Percent: 1980