U.S. AFFLUENCE IN 2000
The discussion about spatial concentrations of poverty in 1980, 1990,
and 2000 point to persistence in certain cores, even as the poorest
county changed and exhibited very different characteristics in 2000
than it did in previous decades. This spatial consistency seems to
be true of affluent counties also, and in particular regarding their
metropolitan nature. Of the most affluent 5 percent of counties (157)
144 were in 54 metropolitan areas and another 8 were in 8 micropolitan
counties. The micropolitan designation was added by the Census Bureau
in 2003; a micropolitan statistical area “must have at least one urban
cluster of at least 10,000 but less than 50,000 population†(U.S.
Census Bureau 2018b). Figure 11 again clearly illustrates that large
cities tend to be the locations of affluent counties, and the 'Boswas'
megalopolis continues to stand out, while Denver seems prominent by
2000.
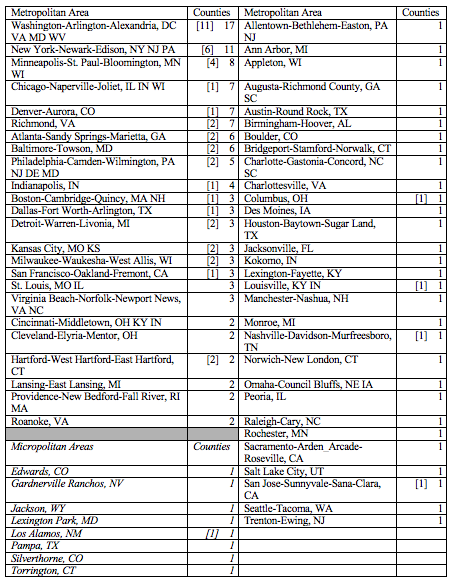
The distribution of affluent counties in particular metropolitan areas
is detailed in Table 6. Washington DC and New York clearly dominate
with respect to the most affluent 50 counties with 17 and 6
respectively. The other 27 of these most affluent counties are spread
over 18 metropolitan areas and one micropolitan area, while two are
located in non-metropolitan counties. Regionally, it is the 'Boswas'
megalopolis that stands out with the Washington DC and New York county
clusters being added to by multiple affluent counties in Baltimore,
Boston, Hartford, Philadelphia, Providence, Richmond, Roanoke, and
Virginia Beach.
As in both 1980, and 1990, the most affluent county was once again
Los Alamos County, New Mexico. Given its unique nature, it is worth
noting that the second most affluent county in 1980, 1990, and 2000
was Falls Church City, Virginia, and in both 1990 and 2000 the third
most affluent county was Fairfax County, Virginia. Both these areas
are part of the 'BosWash' megalopolis which appears to be entrenched
as a region of affluence, even when high cost of living is accounted
for by using INDEX as a measure of affluence and poverty.
Figure 11. The Most Affluent 5 Percent of Counties, 2000
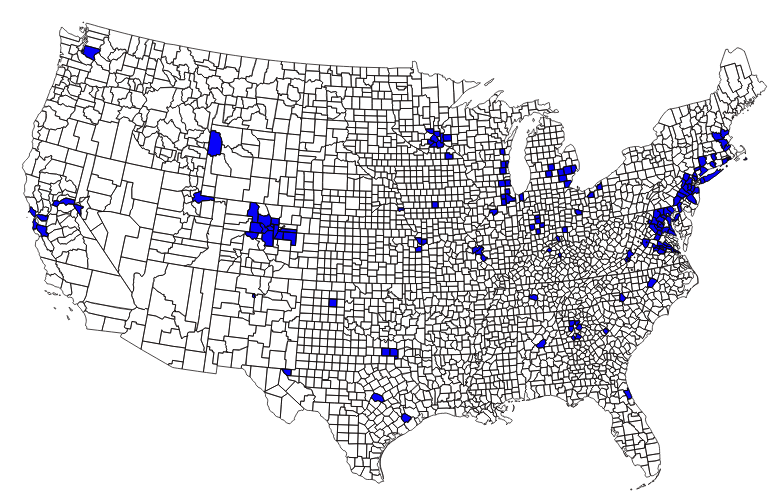 Figure 12. Virginia Counties (Falls Church City and Fairfax)
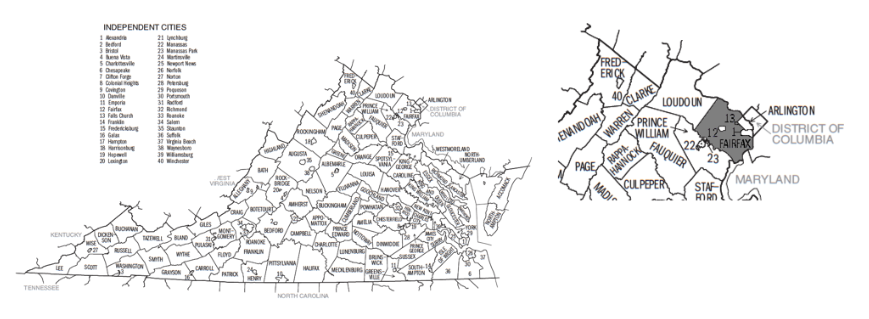 Table 6. Metropolitan and Micropolitan Areas with Counties in the
Most Affluent [50] and 5 Percent: 2000
Table 6. Metropolitan and Micropolitan Areas with Counties in the
Most Affluent [50] and 5 Percent: 2000