Affluence 1980
Affluence 1990
Affluence 2000
U.S. AFFLUENCE IN 2010
The core areas of affluence in 2010 are displayed in Figure 16, and
again a concentration in the 'BosWash' megalopolis is apparent, as well
as in multiple metropolitan areas. However, visually on the map,
there appears to be more affluent counties west of the Great Plains and
outside of the Denver area, than was apparent in 2000 (Figure 16). A
change from 2000 is also clear when looking at the makeup of the most
affluent 5 percent of counties in 2010 (Table 8). Although the list is
still dominated by metropolitan counties, there are more micropolitan
counties and nonmetropolitan counties in the top 5 percent than in any
other the previous study years. Of the 157 counties 116 were located
in 48 metropolitan areas, 13 were located in 12 micropolitan areas. The
remaining 28 counties were located in nonmetropolitan areas in Colorado
(6), Kansas (2), Massachusetts (1), Montana (2), Nevada (1), North Dakota
(5), South Dakota (1), Texas (5), Virginia (2), and Wyoming (3). Clearly
the majority of these counties are in the West. While the most affluent
counties appear to have dispersed somewhat from the northeast, it is
worth noting that the 'BosWash' megalopolis still dominates in terms of
the richest of the rich. Of those most affluent 50 counties 30 are in
the 'BosWash' megalopolis.
As in previous years Los Alamos County, New Mexico is the most affluent
county, followed by Falls Church city, Virginia, and the nonmetropolitan
county of Loving, Texas. Loving County is borders on New Mexico and is
extremely sparsely populated with a total population of 82 in 2010; the
county seat Mentone was home to just 19 residents. It is clear from the
examples of Los Alamos County and Loving County, that when using counties
as the spatial unit of analysis, it is essential to explore the specific
characteristics of these areas. In 2010, if these two counties are
ignored as being special cases, the most affluent four counties are
located in Virginia in the Washington metropolitan area. Thus, it seems
that the nation's capital not only represents a node of power, but also
of economic privilege.
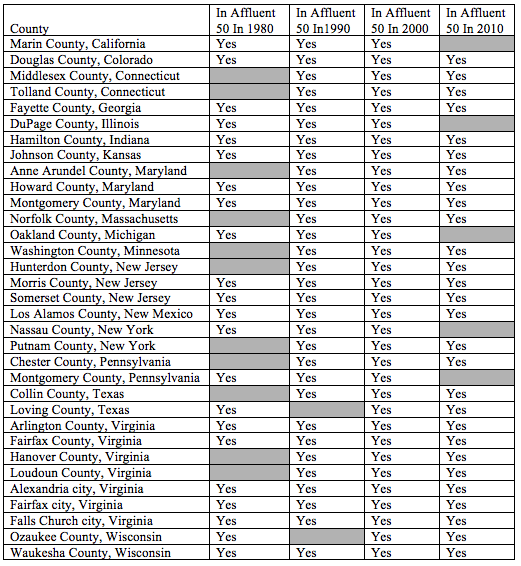
As with poverty, there seems to be a measure of spatial stability from
1980 to 2010 with regards to the most affluent 5 percent of counties.
Figure 17 shows counties that have been in the most affluent 5 percent
in at least three of the four study years. Looking at the most affluent
50 counties Table 9 reveals, over the study period 15 counties remained
in the most affluent 50 in 1980, 1990, 2000, and 2010 and another 18
counties remained in the poorest 50 for three of those years. These 33
counties are located in 18 states, and 9 states were the location of
the 15 counties in the most affluent 50 in all four years (Table 10).
These states are Colorado (1), Georgia (1), Indiana (1), Kansas (1),
Maryland (2), New Jersey (2), New Mexico (1), Virginia (5), and
Wisconsin (1). There is no state that was the location of counties
that stayed in the poorest 50, and the most affluent 50, in all four
years.
Figure 16. The Most Affluent 5 Percent of Counties, 2010
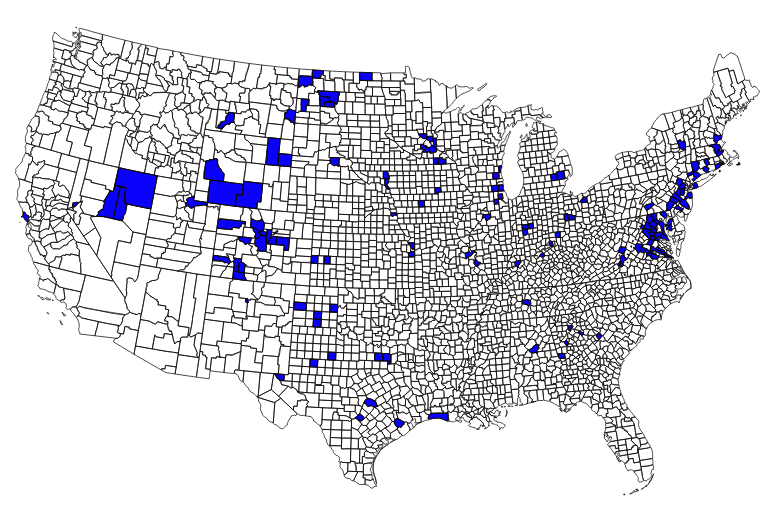 Figure 17. Stable Cores of Affluence, 1980, 1990, 2000, and 2010
 Table 8. Metropolitan and Micropolitan Areas with Counties in the
Most Affluent [50] and 5 Percent: 2010
Table 8. Metropolitan and Micropolitan Areas with Counties in the
Most Affluent [50] and 5 Percent: 2010
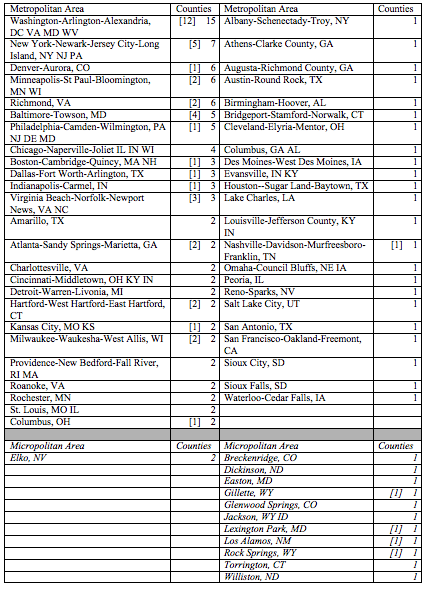 Table 9. Counties Among the Most Affluent 50 in at Least Three Years;
1980, 1990, 2000 and 2010.
Table 9. Counties Among the Most Affluent 50 in at Least Three Years;
1980, 1990, 2000 and 2010.