 Will world population grow to double its present size by 2050?
Will growth slow down and stop soon?
With the personal computer we can narrow the likely trajectory of future world population growth far more than ever before possible. Before the PC, the necessary calculations were too tedious.
Demographers also use the method of "principal components" projection. The principal components on the world level are fertility and death rates. These are applied to only the latest known world population total and projected forward. The widely different results reflect the different assumptions.
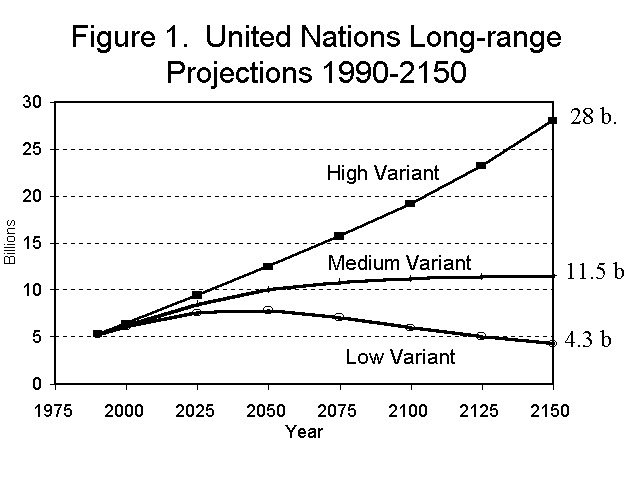
United Nations long range projections . . .

The United Nations "high variant" has world population growing to 28 billion by 2150; the "medium variant" has growth levelling off at 11.5 billion around 2075, and the "low variant" has world population growth ending at 7 billion around 2050 followed by population decrease.
If it were a weather forecast . . .
A weather forecast like that would have us preparing for a blizzard, rain, and a hot dry spell all at the same time. Which is most likely? The medium variant is usually considered the most likely because it is in the middle. But there is another method for finding the most likely path of future world population growth.
Least squares regression . . .
Least squares or regression fits an equation to a set of data points so that the sum of the squared distances between estimates obtained from the equation and actual data points are minimized, hence the name "least squares."
The principal components method is based on a single year's total while the least squares method is based on all past world population totals. The least squares method is more likely to give us a reliable projection than the principal components method and that method corresponds most to the United Nations low variant.
First Requirement for Least Squares . . .
The first requirement for least squares is to get the most reliable estimates of world population in past years. . .I started by assembling all estimates of total world population for 1950 to 1990 published in the United Nations Demographic Yearbook. Then I dropped all estimates that were published only once as least reliable. The remainder I averaged. I figured that the average would be more reliable than any single estimate. For years 1991 to 1993, I used the single estimate published by the UN and for 1994 and 1995 I used estimates published by The Population Reference Bureau.
Convex Growth Fit Best . . .
I tried equations for straight-line growth, exponential growth, logistic growth, and exponential growth at a decreasing rate of increase. The latter I call "convex" growth because it generates a dome shaped projection.
The criterion of best fit is the correlation between actual world population totals and equation estimates closest to a perfect 1.00. The correlation I obtained with the convex formula was .99995997. The figures are in the following table. Notice that the differences between actual figures and equation estimates average only 7.9 million.
| Midyear | World Population (billions) | Convex Growth Estimates | Actual Minus Estimate (millions) |
|---|---|---|---|
| 1950 | 2.502 | 2.498 | 4 |
| 1955 | 2.722 | 2.729 | -7 |
| 1958 | 2.889 | 2.887 | 2 |
| 1960 | 3.006 | 3.000 | 6 |
| 1963 | 3.168 | 3.182 | -14 |
| 1965 | 3.313 | 3.311 | 2 |
| 1970 | 3.664 | 3.659 | 5 |
| 1975 | 4.053 | 4.041 | 12 |
| 1980 | 4.445 | 4.447 | -2 |
| 1985 | 4.847 | 4.868 | -21 |
| 1990 | 5.291 | 5.292 | -1 |
| 1991 | 5.385 | 5.376 | 9 |
| 1992 | 5.479 | 5.459 | 20 |
| 1993 | 5.544 | 5.541 | 3 |
| 1994 | 5.607 | 5.623 | -16 |
| 1995 | 5.702 | 5.703 | -1 |
| Avg. Difference | 7.9 |
The equation is:
Population = 1.639 + .859 (1.02 - (.000342 * (Year - 2039.28) ^ (Year - 1950)
It projects the end of world population growth at 7.07 billion around 2025.

World Population 2000 - 2045
| Midyear | Billions | Midyear | Billions |
|---|---|---|---|
| 2000 | 6.086 | 2025 | 7.067 |
| 2005 | 6.425 | 2030 | 7.009 |
| 2010 | 6.704 | 2035 | 6.863 |
| 2015 | 6.910 | 2040 | 6.635 |
| 2020 | 7.033 | 2045 | 6.337 |
Such an unusual projection demands other supporting evidence. It gets that support from the declining world birth rate and what must become a rising world death rate.
At present the world death rate is 9 deaths per year per 1,000 population. This low a death rate can only be temporary because it would require life expectancy to be 1000/9 = 111 years.

If life expectancy worldwide stabilizes at 75 years, the world death rate would stabilize at 13.3 and a falling world birth rate would intersect a rising death rate around 2030. At about this time, world population growth would stop, which is consistent with the convex growth projection.
While it is certain that the world death rate must rise simply because people will not live an average of 111 years, the decline in the birth rate could slow down, which would make the death and birth rates intersect at a later date.
Compare this world population projection with: U.S. Census Bureau World Population Clock
Go to the Population Reference Bureau and click on 2009 World Population Data Sheet