| Page 1 | Page 2 | Page 3 | Page 4 |
Lesson #3: What is a Rate of Change?
| Example #2:
You are the President of the Student Council at your high school. At
the beginning of the year, you started with 60 members. Unfortunately,
every 2 months, you lose 10 members. What is your Rate of Change? - Ask yourself, "How are my members changing as the time is changing?" - If you said, -10 members/2 months, you're right! (Even better would be the unit rate -5 members/1 month.) Is your graph Increasing or Decreasing? - Ask yourself, "Is the graph going up or down over time?" - Since the graph is going down over time, it is decreasing. - The number of members is decreasing as time increases. - Therefore, the rate of change is negative! | 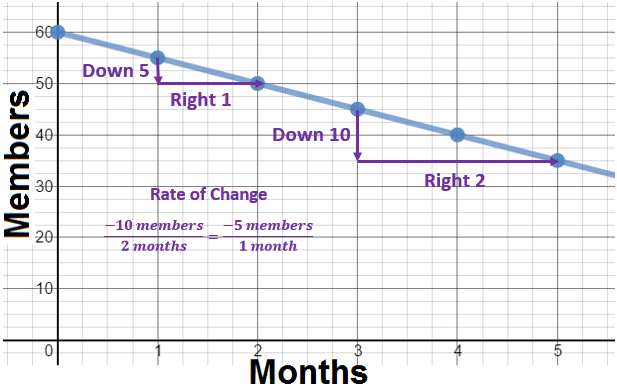 |
